


Important foreword to the benchmark values
A direct performance comparison between different board partner cards – for example between the MSI RTX 5070 Gaming Trio and other custom designs – may seem sensible at first glance, but on closer inspection it leads to methodological inaccuracies and ultimately, with a bit of bad luck, to unfair misinterpretations. This is less due to the benchmark procedures themselves than to the way modern Nvidia GPUs work internally. In particular, two closely linked systems, the Voltage Frequency Engine (VFE) and Continuous Virtual Binning (CVB), ensure that even identical cards with identical BIOS and the same cooling system can exhibit significantly different behavior under load – without any intervention from the manufacturer or user.
Continuous Virtual Binning (CVB) at Nvidia does not describe classic, discrete binning in quality classes, as was common with CPUs or earlier GPU generations. Instead, it is a continuous curve stored on the hardware side, which is determined individually for each graphics chip. This CVB curve defines at which voltage which clock is considered stable and efficient. Each chip that leaves the factory therefore has its own signature that determines how high it can boost – under what conditions, with what voltage and at what temperature.
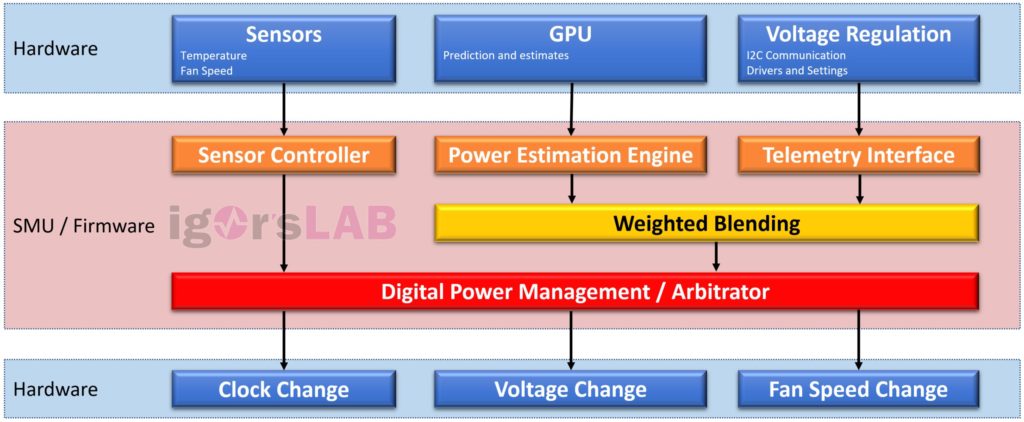
The Voltage Frequency Engine (VFE) picks up on this curve and is responsible for real-time control during operation. It continuously checks thermal, electrical and power parameters and decides dynamically which point on the CVB curve is to be controlled. It is not just a question of whether a higher cycle would be possible, but also whether it is worth using it given the current conditions. The VFE prefers points with high efficiency, i.e. a favorable ratio of performance gain to power consumption. In concrete terms, this means that two RTX 5070s with identical nominal performance and the same boost clock can show completely different frequency curves in practice – depending on how well the individual silicon within the GPU has been manufactured.
These differences, which occur as part of the so-called “GPU lottery”, lead to performance fluctuations of up to two percent in practice – solely due to the manufacturing tolerances and without the intervention of the board partner. Even within a series such as the MSI Gaming Trio OC, two cards can differ by one to two percent in real application performance, even though they formally use the same BIOS and the same cooling. This effect lies entirely within the sphere of influence of VFE and CVB – i.e. in the interaction of silicon quality and boost control.
In addition, there are systematic uncertainties in the measurement: Every benchmark scene is subject to natural fluctuations, so-called Lorenz limits, which result from minimal differences in frame timing, background processes, RAM management or even BIOS revisions of the test system. These tolerances are also in the range of one to two percent and thus overlap directly with the scatter caused by CVB. This makes precise performance comparisons between almost identical cards questionable in terms of methodology, especially as they suggest an accuracy to the reader that is not actually achievable.
With this in mind, it is not only analytically justifiable, but also logical to use the reference values of the Founders Edition when assessing the performance of a GPU generation such as the RTX 5070. This was designed by Nvidia with a standardized power limit and a neutral cooling system that does not include any factory optimization for particularly high boost clocks. Experience shows that well-tuned custom models such as the Gaming Trio OC are only one to two percent higher than these reference values in practice – provided the chip used performs well.
The attempt to derive far-reaching statements on product quality or performance advantages from benchmark comparisons between custom models is therefore not only misleading, but also misjudges the way modern GPU architectures work. More relevant for an evaluation are aspects such as noise behavior, temperature development, electrical stability and processing quality and support – i.e. those features that the manufacturer can actually influence and which I will of course go into in more detail or have already done so. Actual performance, on the other hand, is now subject to a combination of internal chip evaluation (CVB), intelligent load control (VFE) and external framework conditions.
Summary and overview of all games in Full HD

So, of course, I have another, much more precise consideration. Normalizing FPS values and creating a percentage rating for each individual game is much more useful here than cumulative FPS values. Combining all the indices of the various games into a common average serves to present the performance of a hardware objectively and comparably. Such deviations can be recognized very quickly by a slightly different bar sequence, in which individual games can contribute less to distorting the overall impression. I use this metric both for the average FPS and for the P1 Low, i.e. the percentile with the slowest rendered frames.


Summary and overview of all games in WQHD


Summary and overview of all games in Ultra HD
I actually wanted to leave out Ultra-HD (UHD) with a resolution of 3840 x 2160 pixels on this card, but to show the dilemma, I’ll go ahead and include it. Yes, UHD offers exceptional image sharpness, which is particularly noticeable on large monitors, but the downside is the high demands on the GPU, as the number of pixels is four times higher than WQHD. This increases the computing load considerably, especially when effects such as ray tracing are activated, making stable frame rates difficult to maintain.


- 1 - Introduction and unboxing
- 2 - Test system and equipment
- 3 - Teardown: PCB and cooler
- 4 - Material analysis and thermal interface material
- 5 - Gaming performance rasterization
- 6 - Gaming performance Super Sampling, RT & FG
- 7 - Power consumption, transients and PSU recommendation
- 8 - Temperatures, clock rate and thermography
- 9 - Fans speed and noise
- 10 - Summary and conclusion


22 Antworten
Kommentar
Lade neue Kommentare
Veteran
Moderator
Urgestein
Veteran
Veteran
1
1
1
Urgestein
Veteran
Mitglied
Veteran
1
Urgestein
Veteran
1
Mitglied
Mitglied
Mitglied
Alle Kommentare lesen unter igor´sLAB Community →